
Sometimes things take a while, from initial idea to a full-blown feature usable by everyone…
It was October 2018 when Christopher had the idea to integrate Kaleidoscope with lldb, the Xcode Debugger. Back then, he tweeted a gist that showed how to get this to work for his needs.
He needed a way to compare the fidelity of his own RTF parser with what macOS/iOS does. The system parser had a serious bug, plus Christopher wanted two extra features while being fully compatible with the operating system. Except for that bug, of course. Constantly comparing the two generated NSAttributedString objects was a natural fit for Kaleidoscope.
Many moons later, in February 2021, that feature is finally available to every Kaleidoscope user, configurable with the click of a single button.
Read how it came to be realized and why you want to use it, too.
Why did it take so long?
Turns out Christopher had to purchase Kaleidoscope, get himself some team reinforcement, and have them do it. The previous owners of Kaleidoscope never picked up on the idea. They didn’t release any new features in the last 3 years, so that may be why.
After Christopher and I had a few discussions during 2020, Christopher decided to invest in the future of Kaleidoscope. He purchased all assets of the product, hired me and parts of Dominik. And in January 2021, we started to investigate the future of Kaleidoscope. After trying to fix the most pressing memory and stability issues, the idea from October 2018 was the first significant new feature we looked at. The idea is still very viable today.
The Basic Idea
Kaleidoscope is a tool explicitly geared towards finding changes in text or image input. In its most basic usage, you open a bunch of files in Kaleidoscope, and it will show you where those differ. There are many options to adjust this to your need, but at the end of the day, it’s about helping you to find differences (and potentially merging them into a consolidated target).
On the other hand, Xcode provides very nice mechanisms to inspect the app you develop during runtime as you create it. There are fantastic GUI features built into it. A command-line tool called lldb is driving all that magic.
But apart from specialized tools like Instruments, Xcode is not good at comparing differences between things your app does, like computations being made, structures being changed, or images/screens being rendered. Wouldn’t it be great if one could visually compare what exactly your app does during runtime?
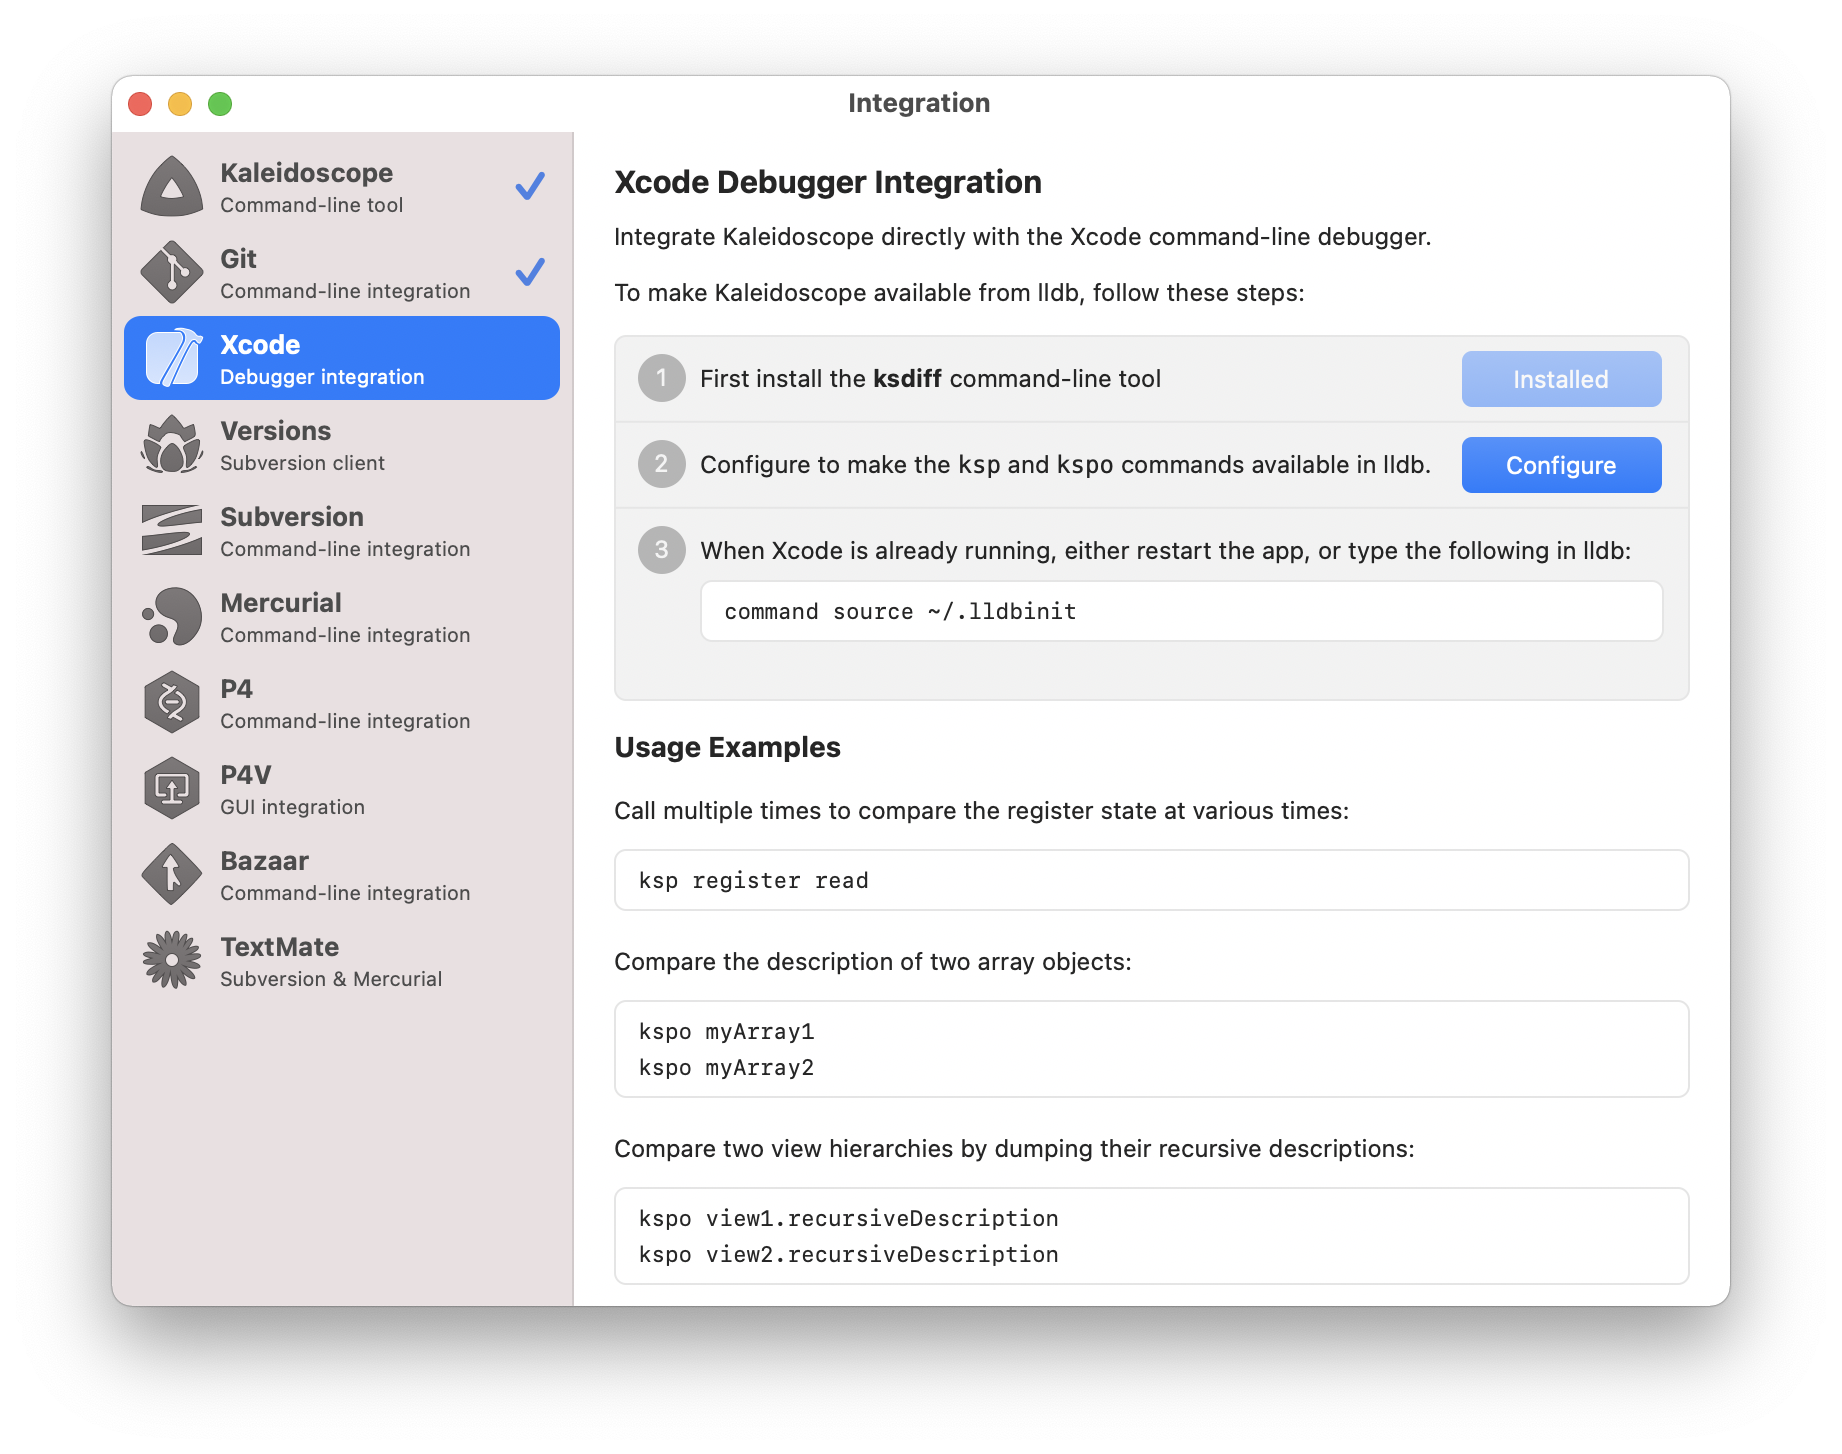
This is where this integration comes in. It helps you send and textual or graphical output of the debugger to Kaleidoscope, so you can inspect differences down to the last character or pixel. As stated above, you just need to click a single Configure button to get started.
How to use it?
Once set up, there are two new commands available to you: ksp and kspo. The idea is to mimic p (print) and po (print object). For usual purposes, they should just work like their counterparts. Check out this fantastic talk called LLDB: Beyond “po” from WWDC 2019 for more in-depth information on lldb and printing.
Let’s assume you have an array you are changing as part of your code. Make sure to break into the debugger before you make those changes to the array. Type kspo myArray, assuming that’s the name of the array.
You’ll notice Kaleidoscope opening a window that shows the description of that array. Now have another breakpoint at the end of your modifications. Once again, type kspo myArray. This is where the fun starts. Now you have both versions of that array in Kaleidoscope, and you can use all tools available there to find the exact differences. Look at them side by using the Blocks view in Kaleidoscope. Maybe you’ll see something went wrong.
You go back to Xcode, edit a file, compile and run again. Once you hit that second breakpoint, the one after the modification, type kspo myArray again. Kaleidoscope will add this new output to the existing ones, and you can now easily compare all three variants, helping you judge whether you got it right this time.

If you no longer need a result, remove that one from the File Shelf in Kaleidoscope. The File Shelf is the top area of the Kaleidoscope window, hosting all inputs. If you want to start over, just close the entire Kaleidoscope window.

Text vs. Images
Sometimes it’s more useful to compare pixels instead of words. Maybe you’re generating some images or even rendering larger views as part of your code. Luckily, Kaleidoscope has powerful tools to compare images, too.

There’s one crucial thing to be aware of: Typically, apps write image files to disk, correctly categorizing them as image files via a UTI or at least a file extension. None of that is available in an environment like lldb. We are just sending the raw data coming from lldb into Kaleidoscope. This means Kaleidoscope needs to be able to understand the data coming in is pixels.
So far, we’ve been successful with converting the PNG representation of TIFF representation of UIImages or NSImages to NSData.
Here’s a simple UIWindow extension I whipped together that gets you a PNG representation of a window of an app ready for sending into Kaleidoscope.
Add the UIWindow+KSSnapshot.swift file to your project, and use it whenever you want to send the content of a window to Kaleidoscope for inspection: kspo window.pngScreenshot()
pngScreenshot() renders a screenshot of the window you pass and returns a PNG representation as NSData. If you end up doing this a lot, make yourself an alias for easy access, so you just need to type kss from then on. This one renders the first window of your app (the only one for most apps) and sends it to Kaleidoscope:
command alias kss kspo UIApplication.shared.windows.first!.pngScreenshot()Advanced Debugging
Two quick ideas to make this even more powerful:
- Add a Debugger Command action to a breakpoint and set it to automatically continue after evaluating. That way, you can continuously send data to Kaleidoscope and inspect the results later, when it’s more convenient. Use the File Shelf mentioned above to navigate the inputs. Also, note the convenient left and right buttons on the right of the File Shelf.
- As po gives you the power of the language you are working with, you can also execute additional commands on the content before sending it to Kaleidoscope. Use filter and friends on Swift arrays and other types to tweak the content to match your debugging needs.

Share your experience
Now with that feature out in the wild, we’d love to know how you use it. Did you discover an unforeseen use case? Are you missing additional features? Comment below, let us know via Twitter or send us mail.
Also, if, by chance, you find something you consider a bug, please make sure to let us know via our support email.
Kaleidoscope screenshots in this article have been created by debugging (slightly modified) Apple sample code projects Handling User Input and Building Custom Views in SwiftUI.
Pingback: Michael Tsai - Blog - Kaleidoscope 2.4.1
Comments are closed.