
As announced last week in Part 1 of our article focusing on JavaScript debugging, this second part shows how to take advantage of Kaleidoscope Developer Tools for Safari when working on web page content and layout.
The extension allows you to send HTML or CSS to Kaleidoscope, enabling you to compare the changes you are making, while you iterate on your latest web page or web app.
In its simplest form, you click the new Kaleidoscope button in the Safari toolbar. This will send the source of the entire page to Kaleidoscope. Doing this repeatedly allows you to easily see differences on the page, as you make changes to various components of the website.
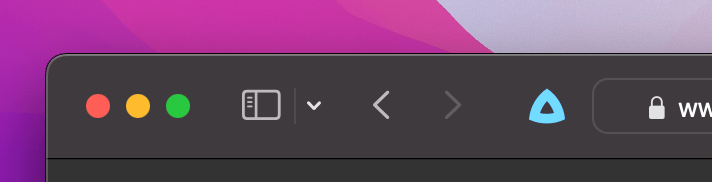
In reality, comparing entires pages may be overwhelming and unnecessary most of the time. To compare smaller sections, use the new Kaleidoscope Dev Tools contextual menu section. It contains two entries:
- ksdiff Element HTML. This will send the HTML element immediately surrounding the mouse pointer to Kaleidoscope.
- ksdiff Element CSS. Same as above, but instead of HTML, it will send all style information for that element to Kaleidoscope.
Both entries enable you to quickly compare details while making changes. You make a change, reload the page and select the appropriate entry over and over, until you are happy with the result.
Use Case: A Simple Color Change
As modern web sites become more and more complex, tracking down a style change might require hunting down an unrelated CSS rule. Sometimes a color change is so subtle, we can only tell that a change was made by checking the code because the change is almost undetectable visually.
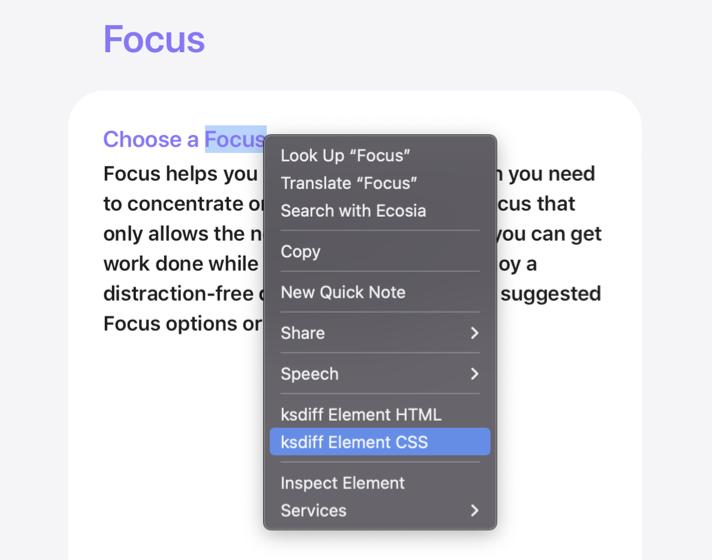
For example, let’s say we are tasked with changing the color of the headline Choose a Focus (selected in the screenshot) to our favorite shade of purple #d883ff (⬛︎).
We’ll start by having a look at the current design and selecting the headline we want to change, followed by selecting Kaleidoscope Dev Tools > ksdiff Element CSS from the context menu.
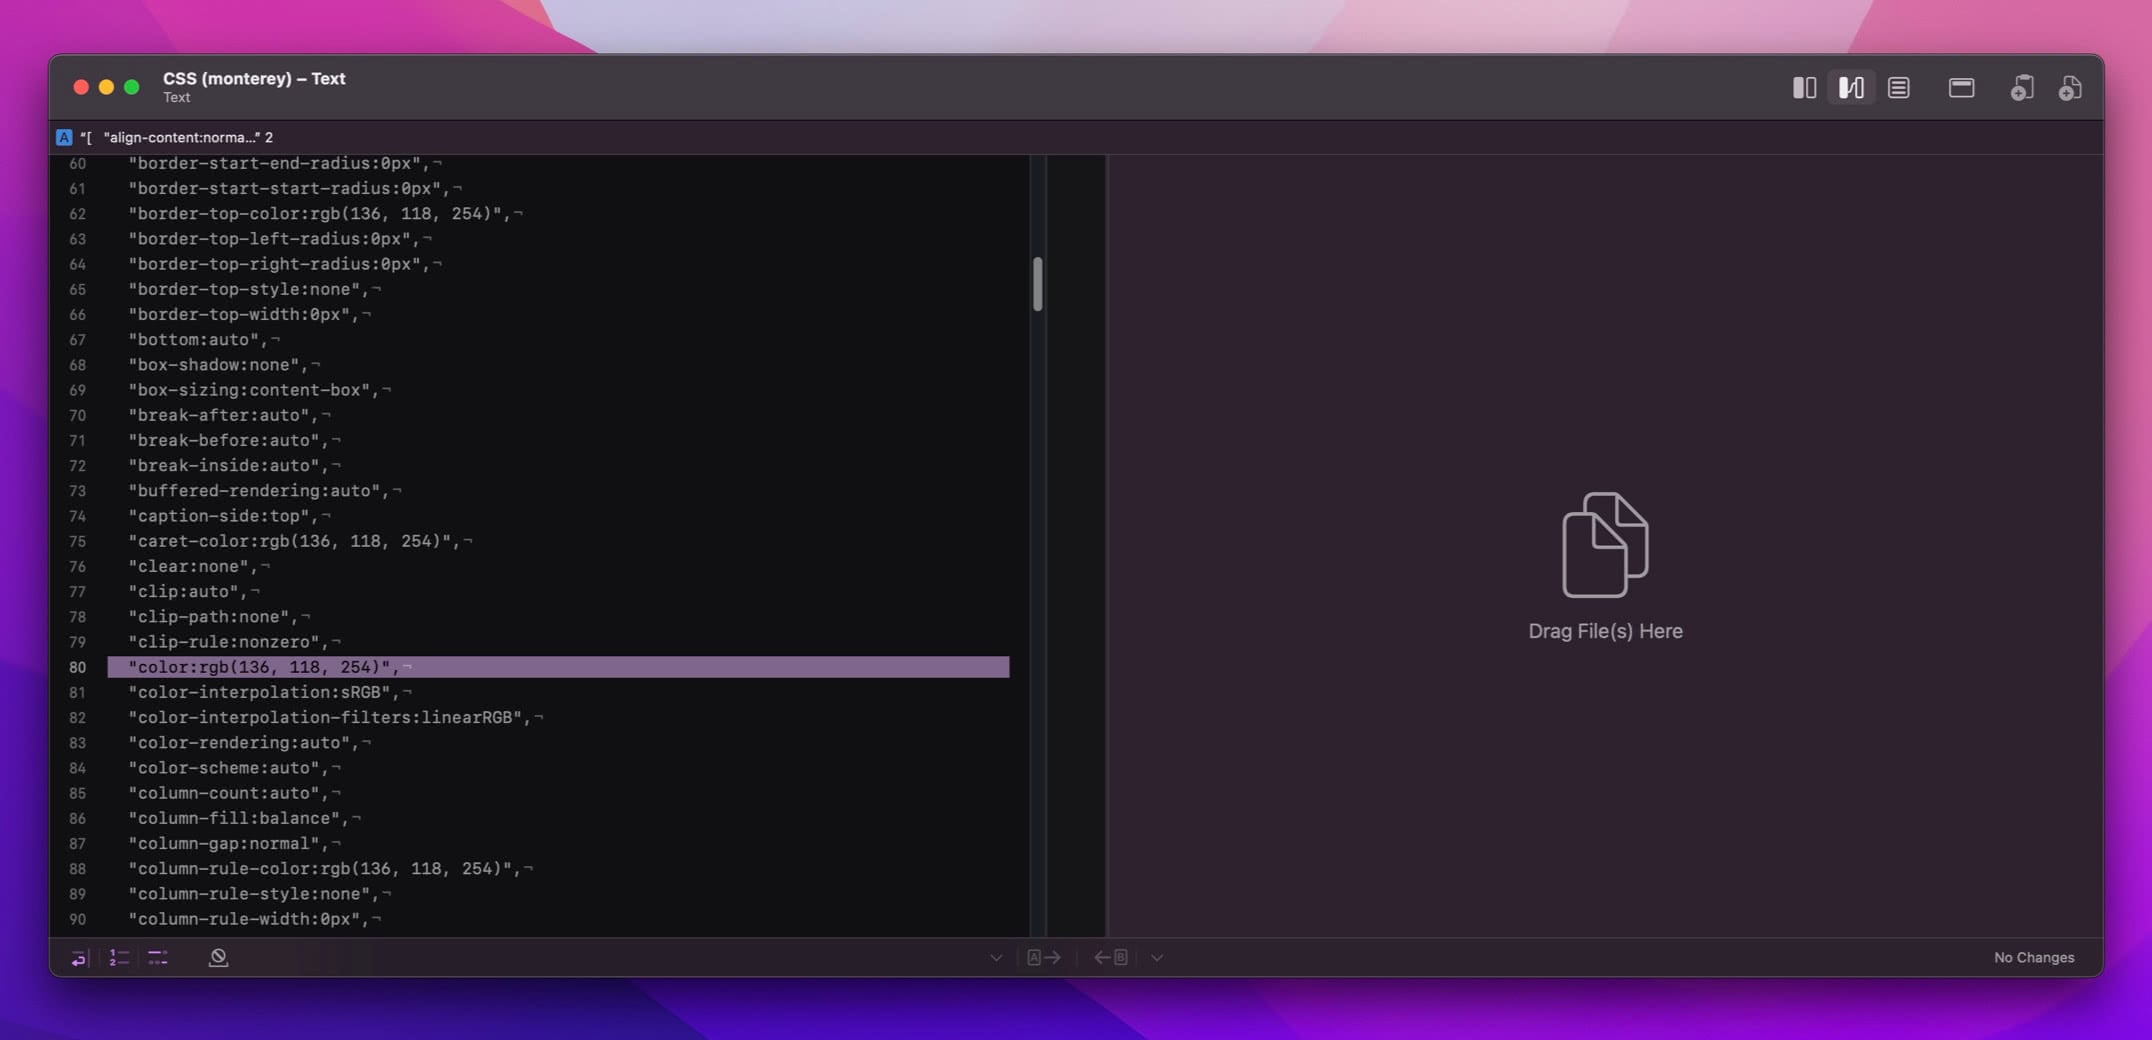
Kaleidoscope opens, showing us all CSS attributes of the selected text in A. We highlighted the color attribute with its rgb value in the long list. This result in itself is both to be expected and typically of no particular value. Bear with us, it’s going to get more interesting.
Now it’s time to implement the requested change. It’s easiest to first try this directly inside Safari, before changing the required file later on, once we have validated the modification working as expected.
We use the Inspect Element entry from the context menu to open the Web Inspector and see where the color is defined in the stylesheet. We locate the style class named tile-headline.
Next we create a local overwrite in Safari and change the color in the style containing tile-headline to the requested value #d883ff.

Mission accomplished, right? After reloading the page, the headline Choose a Focus has changed in color.
To verify, we run Kaleidoscope Dev Tool > ksdiff Element CSS on the same element again. Now we learn that our small change not only affected the text color, but also several others, like the border color. We see 19 changes in Kaleidoscope, when we only wanted to change one color value:
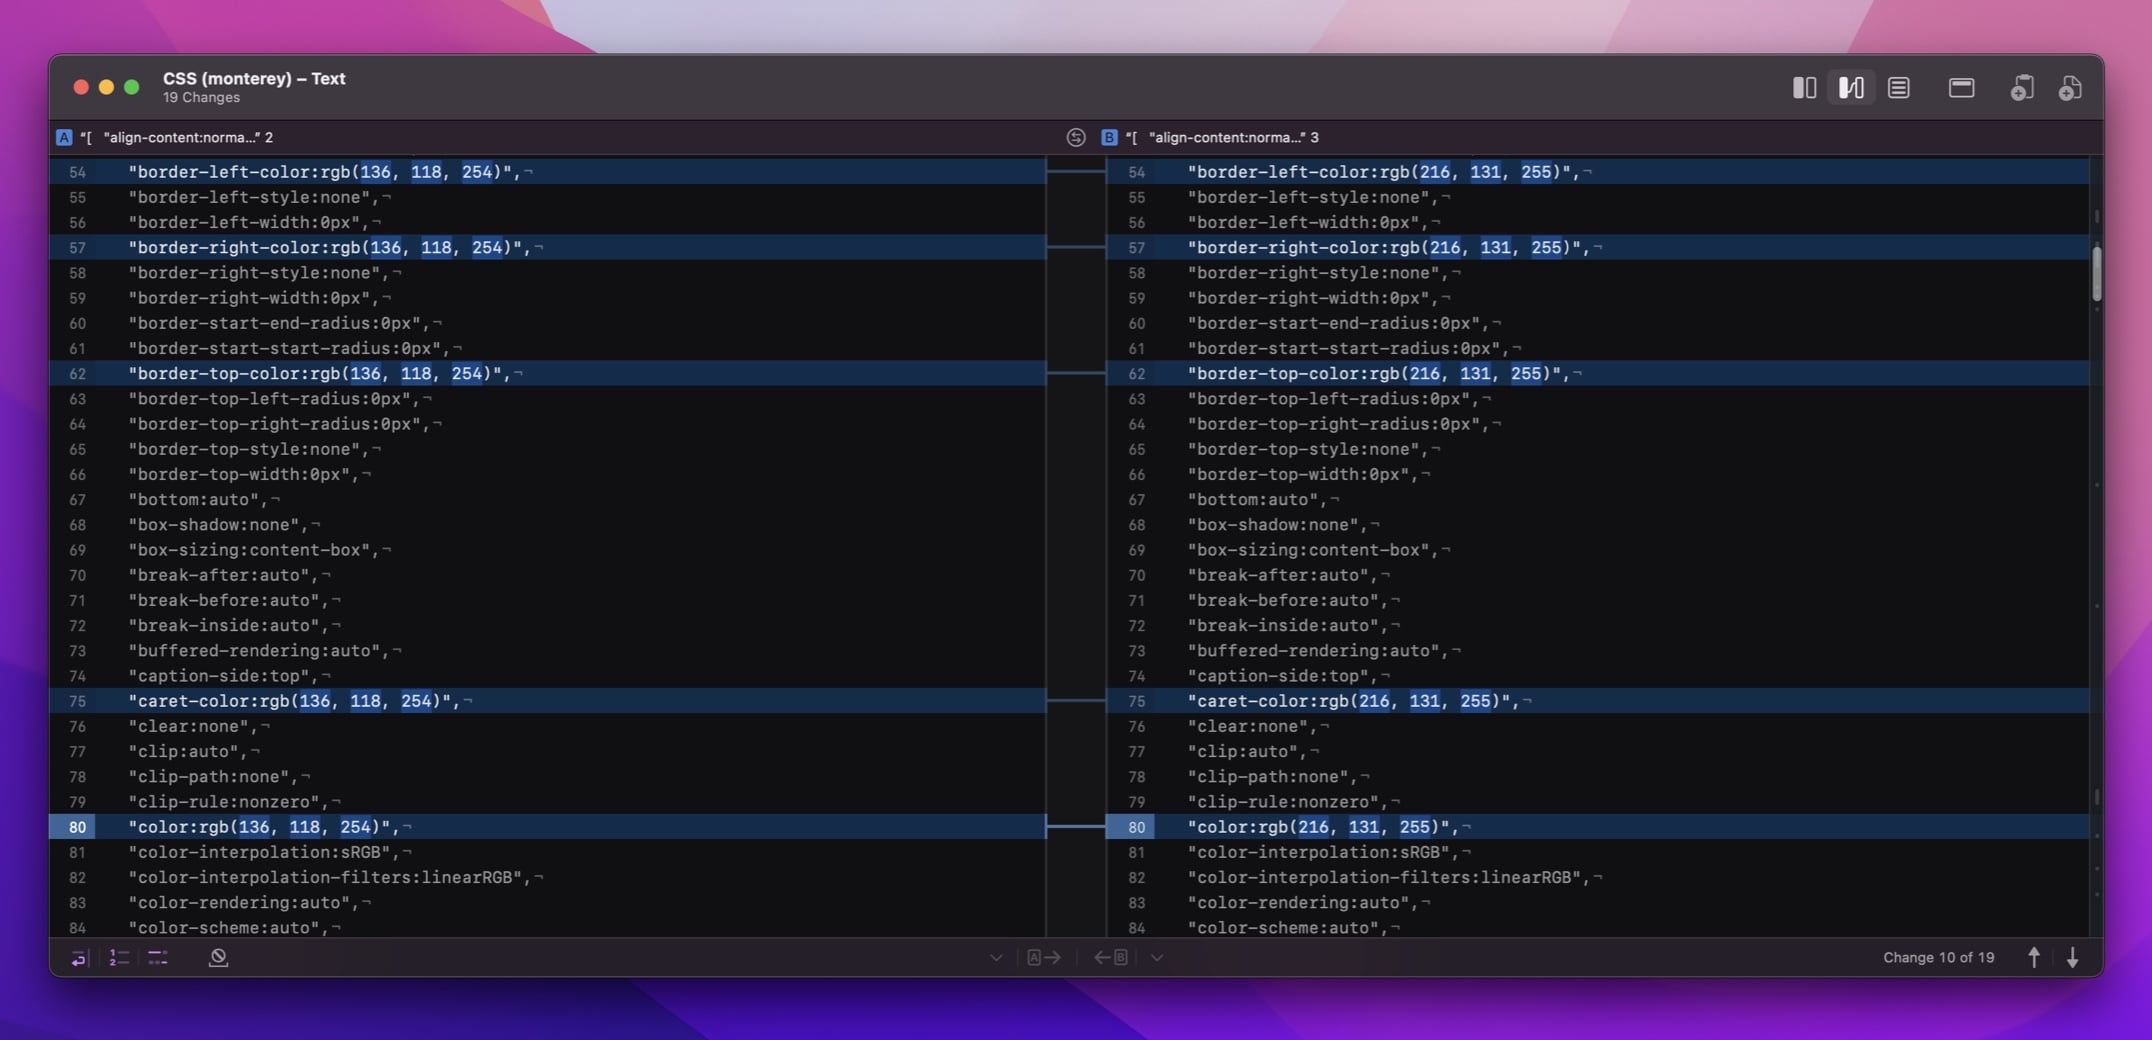
So obviously a more granular approach would be needed to complete this request…
To summarize: by comparing and verifying changes with Kaleidoscope, you’ll get peace of mind knowing that the changes you make on the backend do have the exactly the desired outcome on the front end.
Be a JavaScript Hero
The context menu in Safari does come with limitations. It is designed for end users, and so it is not as fine-grained as the Web Inspector. The good news is that we can use Inspect Element in the JavaScript console.
$0 is equal to the currently selected DOM node in the DOM Tree in the Elements Tab.
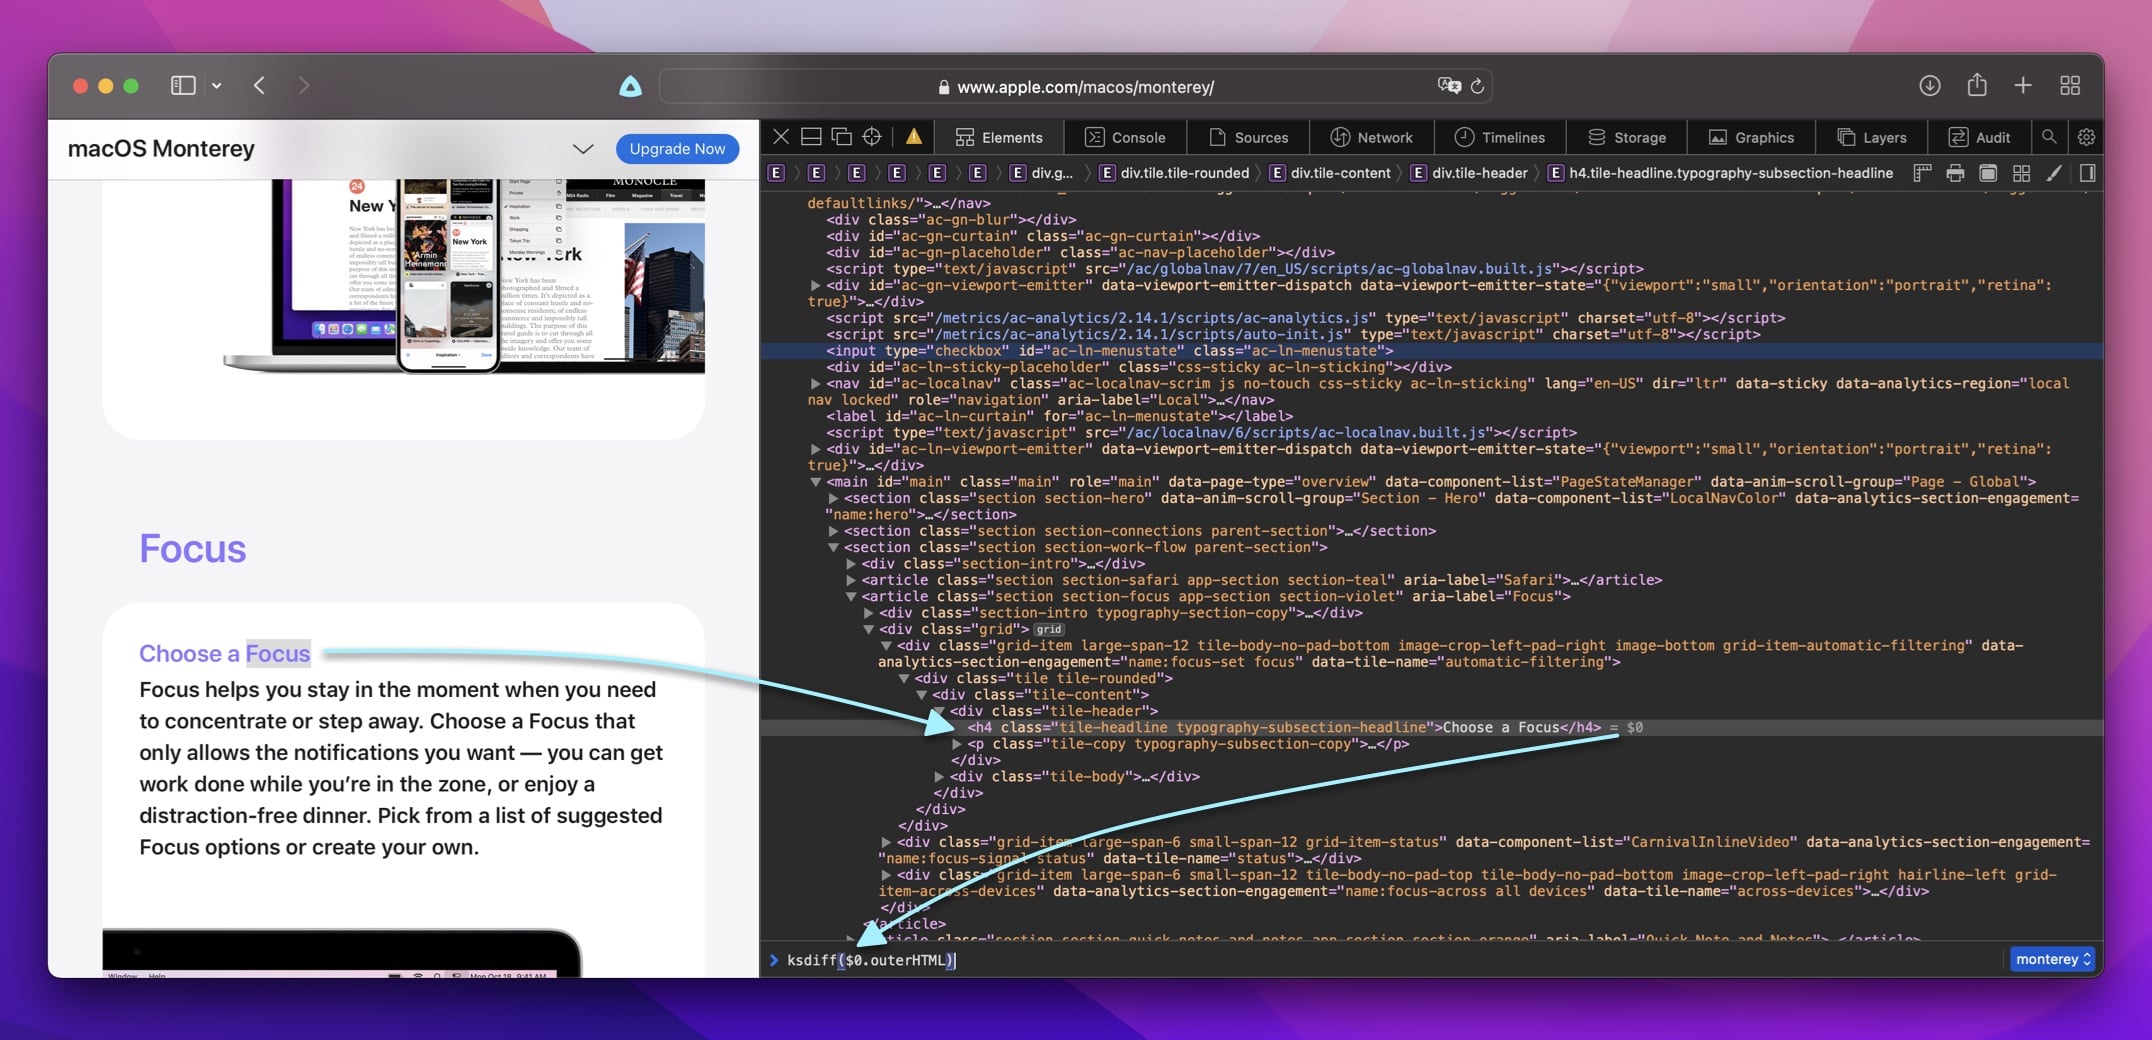
Using the ksdiff() function, as explained in detail in part 1 of this article, you can now send very specific elements to Kaleidoscope, by first selecting something in the web page, choosing Inspect Element from the context menu and then entering ksdiff($0.outerHTML) into the console. If you want to log the parent element, just type ksdiff($0.parentElement.outerHTML) instead.
Related Topics
Comparing Web Content with the Share Extension
Sometimes you may want to compare just the text content of a website, not the actual HTML or CSS code of the page. This is where the Kaleidoscope Share Extension shines.
Use it either from the Safari toolbar to share the entire page or on a selection from the context menu to share just that selection. Again, use it multiple times on the same page to track changes or even compare paragraphs of different web sites to see how close the content is.

Working with VSCode?
If you work on websites or web apps using Microsoft Visual Studio Code (VSCode), please check out Kaleidoscope for Visual Studio Code, our new extension for VSCode. You’ll find more information in the Kaleidoscope Integration window. We think you’re going to like it!